How Much Does It Cost to Run a Delivery Route? The Full Per-Stop Math
In this article
Ask what a delivery route costs and most answers point at the fuel gauge. Fuel is real money, but it is the fourth-largest line on the bill, not the first. The first is sitting in the driver's seat. This is a unit-economics explainer for small fleets — 2 to 20 vans — built so you can swap in your own numbers: every input is a published national figure with its source and date named, and every derived number shows its math.
The short answer
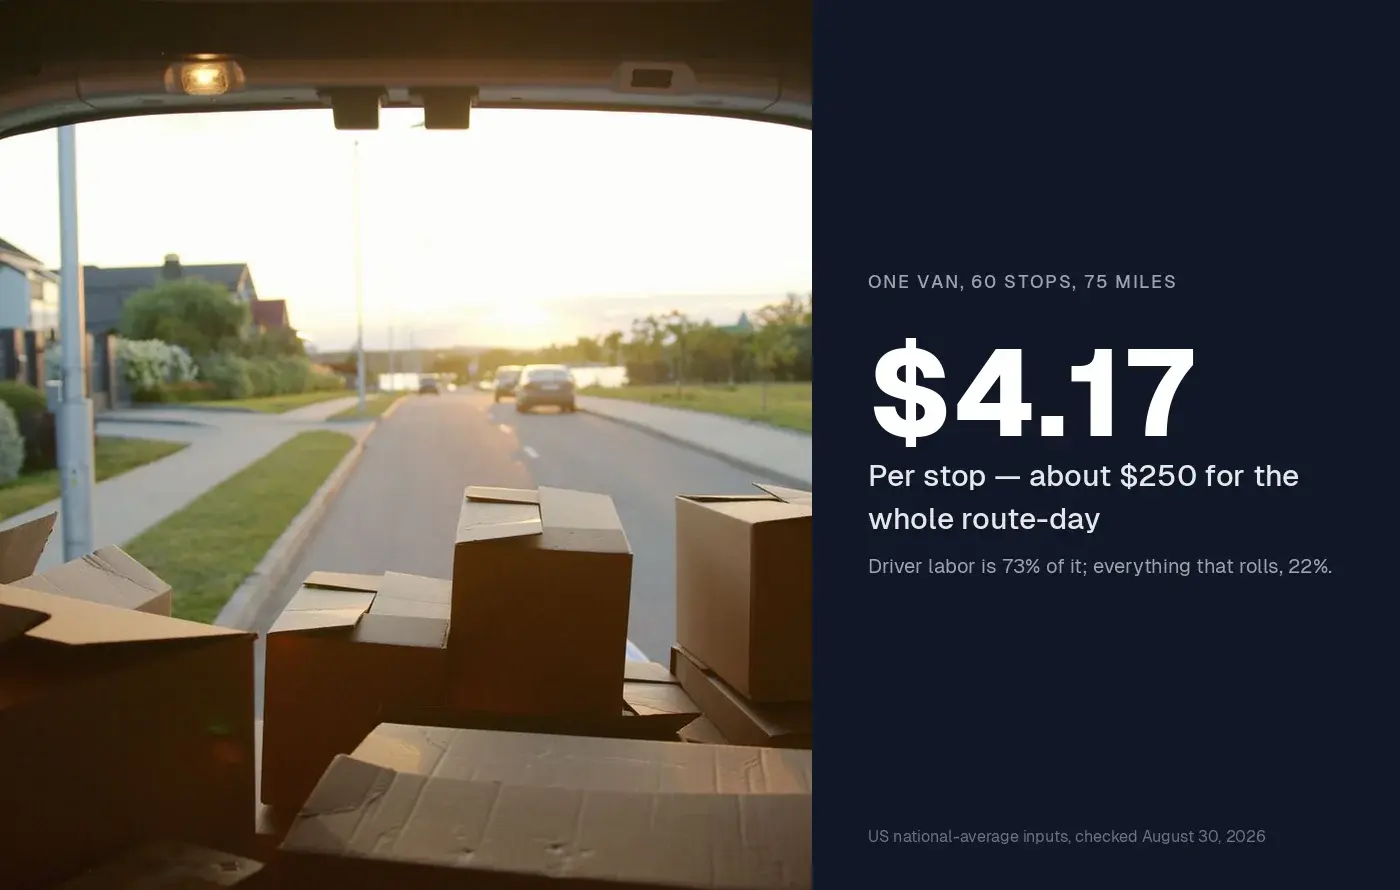
- 1One van running an 8-hour, 60-stop, 75-mile route-day costs about $250 at US national-average inputs — roughly $4.17 per stop.
- 2A realistic small-fleet range is $3–6 per stop: the same route-day is $5.56/stop at 45 stops and $3.13/stop at 80.
- 3Driver labor is about 73% of the bill. Fuel, depreciation, and maintenance together are about 22%. Software is under 1%.
- 4Costs scale linearly with van count — a 12-van fleet pays the same per stop as one van. Per-stop cost falls only when stops per day rise or miles per stop fall.
- 5Each route-mile you cut is worth 45–74¢; each paid hour, $22.84. That is the whole business case for route optimization, and the math is below.
For scale: at these inputs one van costs about $66,100 a year to operate — and the software line in that figure is $240.
All costs on this page were checked on 30 August 2026 against the sources named next to them. Wages, fuel, and insurance drift; if you are reading this months later, re-check the inputs before you budget from them.
The six lines of a route-day, and where each number comes from
The model has six cost lines. Here is every input, with its source, before any arithmetic happens.
| Input | Value | Source (checked 30 Aug 2026) |
|---|---|---|
| Driver wage, median | $44,140/year → $21.22/hour | BLS OEWS, light truck drivers (SOC 53-3033), May 2024 — the latest published figure |
| Employer payroll taxes | +7.65% | IRS — employer share of Social Security and Medicare (FICA) |
| Fuel price | $4.09/gallon | AAA national average, regular — a record-expensive August at the pump |
| Van fuel economy | 12 mpg | EPA rates a gas Ford Transit T-150 at ~15 mpg city; real-world stop-and-go delivery reporting (Cars.com testing, owner forums) runs 10–12. We use 12. |
| Depreciation | $4,334/year over 15,000 miles → 28.9¢/mile | AAA Your Driving Costs 2025 (new-vehicle average, 5 years / 75,000 miles) |
| Maintenance, repair & tires | 11.04¢/mile | AAA Your Driving Costs 2025 |
| Commercial auto insurance | $245/month per vehicle | Insureon published customer average (40% pay under $200/month) |
| Route software | $240/year per driver seat | Routerra Teams, $20/seat/month billed annually ($25 monthly) — see our pricing breakdown |
Three honesty notes. The BLS number is a median — half of employers pay more, and it excludes benefits, overtime, and workers' comp, so $21.22 is a floor. The AAA per-mile figures come from a passenger-vehicle study; a loaded cargo van wears faster, so they are conservative too. And a useful cross-check: our per-mile lines sum to 74¢ (fuel 34.1¢ + depreciation 28.9¢ + maintenance 11.04¢), right next to the IRS standard mileage rate of 76¢/mile for July–December 2026 — a rate the IRS raised mid-year from 72.5¢ specifically because of fuel costs. Two independent routes to the same number is about as good as cost modeling gets.
The worked example: one van, one 60-stop day
Assumptions, stated so you can re-run them: one driver, 8 paid hours, 60 stops, 75 route-miles (dense suburban multi-drop typically runs 1–1.5 miles per stop including the stem miles to and from the depot), 22 delivery days a month — 264 route-days and 19,800 miles a year.
| Cost line | The math | Per route-day |
|---|---|---|
| Driver labor | $21.22 × 1.0765 = $22.84/hr loaded × 8 h | $182.76 |
| Fuel | 75 mi ÷ 12 mpg = 6.25 gal × $4.09 | $25.56 |
| Depreciation | 75 mi × 28.9¢ | $21.67 |
| Maintenance, repair & tires | 75 mi × 11.04¢ | $8.28 |
| Commercial insurance | $2,940/yr ÷ 264 route-days | $11.14 |
| Route software | $240/yr ÷ 264 route-days | $0.91 |
| Total | $250.32 |
Cost per stop: $250.32 ÷ 60 = $4.17.
Where one $250.32 route-day goes
- Driver labor$182.7673%
- Fuel$25.5610.2%
- Depreciation$21.678.7%
- Commercial insurance$11.144.5%
- Maintenance, repair & tires$8.283.3%
- Route software$0.910.4%
Look at the proportions. Labor is 73% of the route-day. Everything that rolls — fuel, depreciation, tires, maintenance — is 22%. Insurance is 4.5%. The software that decides how far the van drives and how long the driver is out is 0.4% — a $1-a-day line working against a $250 daily bill. It does not need to be transformative to pay for itself; it needs to shave minutes.
Scaling it: 1, 3, 6, and 12 vans
Same assumptions per van, annual view, rounded to the nearest hundred dollars.
| Fleet | Route-days/year | Miles/year | Stops/year | Annual operating cost | Cost per stop |
|---|---|---|---|---|---|
| 1 van | 264 | 19,800 | 15,840 | $66,100 | $4.17 |
| 3 vans | 792 | 59,400 | 47,520 | $198,300 | $4.17 |
| 6 vans | 1,584 | 118,800 | 95,040 | $396,500 | $4.17 |
| 12 vans | 3,168 | 237,600 | 190,080 | $793,000 | $4.17 |
Operating cost per stop by fleet size
$3.79 — the same route-day at 66 stops per van, not 60
The flat right-hand column is the uncomfortable finding. Delivery has no operational economies of scale at this size. Van twelve costs exactly what van one costs; growing from 3 vans to 12 quadruples bill and capacity in lockstep. Only two things change shape as you grow: software pricing — per-seat plans quadruple from 3 to 12 vans while per-stop plans nearly flatten, the whole subject of our pricing teardown — and dispatch, because somewhere around van three, planning routes becomes a real chunk of someone's morning. That is an unpriced line in this model; price it in yours.
So if scale will not lower your cost per stop, only two things will: the numerator (what a route-day costs) and the denominator (how many stops fit in it).
Which lines route optimization actually moves
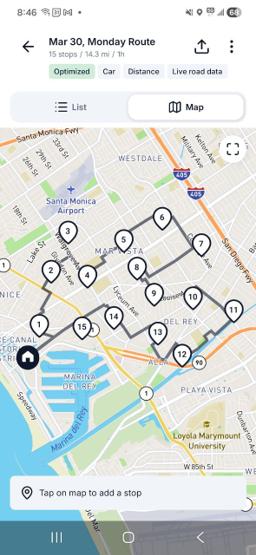
Route optimization gets sold with vague percentages. Here is what each lever is actually worth in this model — so you can judge any vendor's claim, ours included, against your own inputs.
Miles → fuel + vehicle wear: 45–74¢ per mile cut. Fuel is 34.1¢/mile ($4.09 ÷ 12 mpg) and maintenance/tires 11.04¢ — 45¢ of hard cash that leaves your account with every mile. Depreciation adds another 28.9¢, though it is partly time-based rather than mileage-based, so treat 45–74¢ as the honest range. On 19,800 route-miles a year per van:
| Mileage cut | Miles saved/van/year | Cash savings (45¢/mi) | Full-cost savings (74¢/mi) |
|---|---|---|---|
| 10% | 1,980 | $891 | $1,465 |
| 15% | 2,970 | $1,337 | $2,198 |
| 20% | 3,960 | $1,782 | $2,930 |
A 10–20% mileage reduction is the range optimization vendors typically claim; whether you get it depends on how bad the current routes are. If your drivers already sequence stops well, expect the low end. If routes are built from a spreadsheet in drop-off order, the high end is plausible. Either way, even the worst case — 10%, cash costs only — is $891 per van per year against a $240 software seat.
Hours → wages: $22.84 per hour, the big one. Sequencing the same stops into a shorter drive shortens the paid day. Thirty minutes saved per route-day is $11.42, or $3,015 per van per year (0.5 h × $22.84 × 264 days). One honest caveat: this is cash only if drivers are hourly and actually clock out earlier. If they are salaried, or the saved half-hour absorbs into the day, what you bought is capacity, not savings — valuable, but a different line on a different statement.
Stops per day → the denominator. The route-day costs $250.32 whether it completes 55 stops or 66. Fit six more stops into the same 8 hours and cost per stop falls from $4.17 to $3.79 — a 9% unit-cost improvement with zero cost reduction. For a fleet paid per delivery, this is the lever that shows up directly as margin.
What optimization does not move: insurance, the wage rate itself, and depreciation's time-based share. Roughly $14 of the $250 day is fixed no matter how clever the route. Everything else — about 94% of the bill — is miles and hours.
What this model leaves out
So you can add them back: vehicle finance (AAA prices the average new-vehicle loan at $1,131/year — $4.28 per route-day — if your vans are financed), license, registration and taxes (AAA: $813/year), workers' comp and benefits above the 7.65% payroll floor, tolls and parking, failed-stop re-attempts (a second visit doubles that stop's cost), and dispatcher time. None of these change the shape of the answer; most make the labor-dominance starker.
The model is deliberately simple enough to rebuild in a spreadsheet in ten minutes with your own wage, fuel receipts, and insurance quote. Do that before you believe anyone's savings pitch — including the one two sections up. Then our cost-per-stop benchmarks show where your number sits against operations your size, and the dispatch guide covers running multiple vans on this math day to day.
Frequently Asked Questions
How much does it cost to run one delivery van per day?
About $250 per route-day at US national-average inputs, checked 30 August 2026: $183 in driver labor (BLS median wage of $21.22/hour for light truck drivers plus 7.65% employer payroll taxes, over 8 hours), $26 in fuel (75 miles at 12 mpg and AAA's $4.09/gallon average), $30 in depreciation and maintenance (AAA Your Driving Costs 2025 per-mile figures), $11 in commercial auto insurance (Insureon's $245/month average), and about $1 in route software. Your own wage, mileage, and insurance quotes can move that number substantially in either direction.
What is a good cost per stop for local delivery?
At national-average inputs a van doing 60 stops over an 8-hour day costs about $4.17 per stop. The same route-day costs about $5.56 per stop at 45 stops and $3.13 at 80, so a realistic small-fleet range is roughly $3 to $6 per stop. To compute yours, add up one van's full daily cost — loaded driver wage, fuel, per-mile vehicle wear, insurance, and software — and divide by stops completed, not stops planned.
What is the biggest cost of running a delivery route?
Driver labor, and it is not close. At the BLS median wage for light truck drivers ($44,140 a year, or $21.22/hour) plus the 7.65% employer share of Social Security and Medicare, an 8-hour route-day costs about $183 in labor out of roughly $250 total — about 73%. Fuel, depreciation, and maintenance together are about 22%, insurance about 4%, and route-planning software under 1%.
How much money does cutting route miles actually save?
Between 45 and 74 cents per mile cut, depending on how you count. Fuel at $4.09/gallon and 12 mpg is 34.1 cents per mile, and AAA prices maintenance, repair, and tires at 11.04 cents — 45 cents of hard cash per mile. Add AAA's depreciation figure of 28.9 cents per mile and the full rate is 74 cents. On a van driving 19,800 route-miles a year, a 10% mileage cut is worth roughly $890 to $1,470 per van per year; 20% is worth $1,780 to $2,930.
Does cost per stop go down as a delivery fleet grows?
Mostly no. Wages, fuel, vehicle wear, and insurance all scale linearly with van count, so a 12-van fleet pays about the same per stop as a 1-van operation — about $4.17 at national-average inputs. The per-stop number falls when each van completes more stops per day or drives fewer miles per stop, not when you add vans. The one line with real scale economics is software, where per-seat and per-stop pricing models diverge sharply as fleets grow.