Delivery Cost per Stop: Real Benchmarks for a 2–20 Van Fleet
In this article
Search "delivery cost per stop" and you will meet the same number on every page: last-mile delivery costs about $10 per package. That number is real — and it describes FedEx-scale retail networks, measured in 2018. It says almost nothing about what a stop costs your three vans this week. This page builds small-fleet benchmarks from inputs you can check — BLS wages, EIA fuel, the IRS vehicle rate — and shows the math so you can re-run it with your own numbers.
Cost per stop for a small fleet, 2026
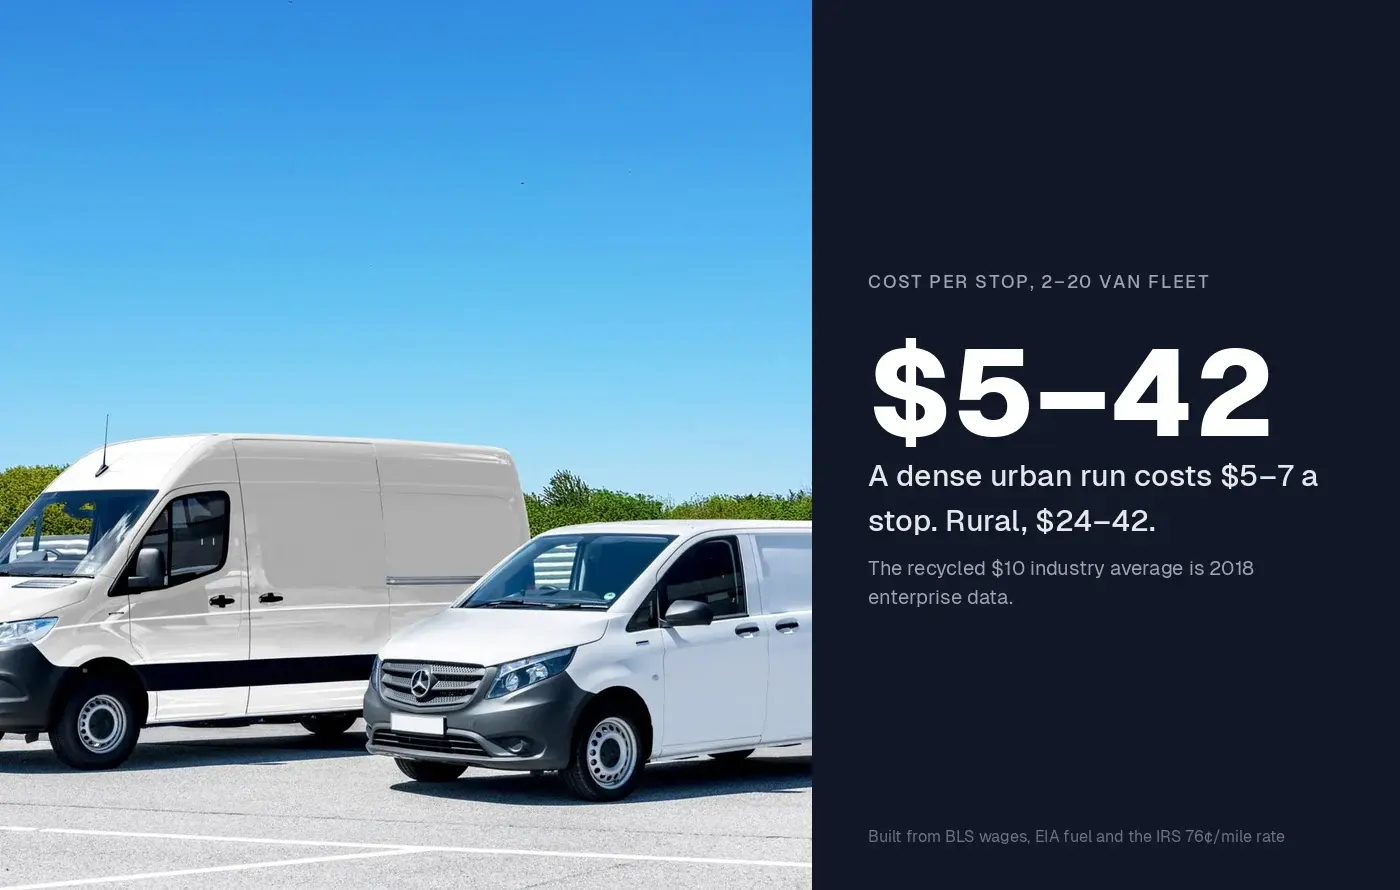
- 1Dense urban multi-drop (35–45 stops/driver/day): roughly $5–7 per stop.
- 2Suburban local delivery (15–25 stops/day): roughly $9.50–17 per stop.
- 3Rural or wide-area (8–12 stops/day): roughly $24–42 per stop.
- 4The famous ~$10 'industry average' is a 2019 Capgemini figure from large retail and consumer-product companies — it is not a small-fleet benchmark.
- 5Your own number: (loaded driver pay + route miles × $0.76 + software) ÷ stops completed.
Built from the BLS median light-truck-driver wage (May 2024), EIA gasoline at $4.085/gal (week of Aug 24, 2026) and the IRS business vehicle rate of 76¢/mile (Jul–Dec 2026). Full assumptions per row below.
Where the famous $10 number actually comes from
The most-recycled stat in last-mile content traces to the Capgemini Research Institute report The Last-Mile Delivery Challenge (January 2019). Surveying 500 supply-chain executives at large consumer-product and retail firms in late 2018, it found last-mile delivery cost the organization an average of $10.10 per delivery while customers paid an average of $8.08, and made up 41% of total supply-chain cost.
Both numbers are fine for what they are: enterprise retail, food-and-grocery-heavy, 2018 dollars. Neither transfers to a five-van local fleet. A parcel-network driver can clear 100+ stops a day — against that denominator, $10 a stop is actually high — and enterprise figures carry cost lines you don't have (sortation, corporate overhead) while skipping ones you do. FedEx-scale ≠ your fleet. The useful benchmark is built from your own cost structure, which is what the rest of this page does.
What couriers charge per stop is a better sanity check
A courier company's price per stop must sit above its cost per stop or it dies — so published rates are a useful ceiling. Breakaway Courier's New York rate card (checked 30 August 2026) lists a $26.50 base-zone messenger delivery, $21.15 per delivery on its economy service with a 10-delivery minimum, and $13.15 for an additional stop in the same building. Courier pricing guides cite around $22 per route-stop for scheduled medical and lab routes, with discounts above ~200 stops a month.
If routed courier work retails at roughly $13–27 a stop in a high-cost metro, an efficient operator's internal cost is meaningfully below that. Your fleet should land in or under the same territory — dense routes well under, sparse rural routes legitimately over.
The inputs, verified
Every figure below was checked on 30 August 2026:
| Input | Value | Source and scope |
|---|---|---|
| Driver wage (median) | $21.22/hr ($44,140/yr) | BLS OEWS, light truck drivers (53-3033), May 2024 — most recent published |
| Loaded driver cost | ~$25/hr | Median wage + ~15–18% employer payroll taxes and workers' comp (our load; benefits push it higher) |
| Vehicle, all-in | $0.76/mile | IRS business standard mileage rate, Jul 1–Dec 31, 2026 (Announcement 2026-11; it was 72.5¢ in H1) |
| Gasoline (fuel-only) | $4.085/gal → ~$0.27/mile at 15 mpg | EIA weekly retail average, week of Aug 24, 2026 |
| Software | $0.05–0.08/stop | Routerra Teams at $20–25/driver/month ÷ 330–440 stops/month — see our pricing breakdown |
The IRS rate is the honest shortcut: it bundles fuel, maintenance, tires, insurance and depreciation into one auditable number. A heavy cargo van costs more than 76¢ a mile; a Corolla-based courier costs less. If you track your true vehicle cost, use it — otherwise 76¢ keeps you from the classic small-fleet error of counting fuel and forgetting everything else. Fuel alone is only ~27¢ of it — check your own routes with the gas cost calculator.
Benchmark cost per stop by fleet profile
Same loaded driver ($25/hr, 8 paid hours = $200/day), same vehicle rate. The only things that change are stops and miles — and they change everything.
| Profile | Stops/day | Route miles | Labor/day | Vehicle/day (76¢/mi) | Day total | Cost per stop |
|---|---|---|---|---|---|---|
| Dense urban multi-drop (food, retail, pharmacy) | 35–45 | 30–40 | $200 | $23–30 | $223–230 | $5.00–6.60 |
| Suburban local delivery (parcel, e-comm, bakery) | 15–25 | 50–70 | $200 | $38–53 | $238–253 | $9.50–16.90 |
| Rural / wide-area | 8–12 | 120–180 | $200 | $91–137 | $291–337 | $24.30–42.10 |
Cost per stop by fleet profile, 2026
- Dense urban multi-drop$5.00–$6.60
Food, retail, pharmacy — 35–45 stops over 30–40 miles
- Suburban local delivery$9.50–$16.90
Parcel, e-comm, bakery — 15–25 stops over 50–70 miles
- Rural / wide-area$24.30–$42.10
8–12 stops over 120–180 miles
$10.10 — Capgemini 2019 enterprise average
Notice the eight-fold spread between the cheapest urban stop and the dearest rural one comes from the same driver at the same wage. Cost per stop is not a wage story. It is a density story.
The denominator effect: the cheapest stop is one added to an existing route
The suburban van costs $245.60 a day ($200 loaded labor + 60 miles at 76¢) almost no matter how many stops it makes. Stops added to a territory you already cover barely move the day cost while the denominator grows.
| Stops/day | Day cost (labor $200 + 60 mi × 76¢) | Cost per stop |
|---|---|---|
| 10 | $245.60 | $24.56 |
| 15 | $245.60 | $16.37 |
| 20 | $245.60 | $12.28 |
| 25 | $245.60 | $9.82 |
| 30 | $245.60 | $8.19 |
Cost per stop vs stops per day — same van, same route
At 20 stops your average stop costs $12.28, but the next stop added to that route costs only about $3.50–4 — six minutes of driver time (~$2.50) plus a mile and a half (~$1.14). Every stop won inside an existing territory is bought at the marginal price and sold at the average one. That is the entire economic case for filling routes before adding vans.
The levers, ranked by dollars per stop
Modeled on the 20-stop suburban baseline ($12.28/stop). Ranges shown because your route is not our model.
| Lever | Change modeled | Impact per stop | Why |
|---|---|---|---|
| 1. Density (stops per route) | 15 → 20 stops on the same route | −$4.09 | Pure denominator: same day cost, more stops |
| 2. Miles and drive time | −15% miles and ~40 min of drive time via better sequencing | −$1.00 to −$1.30 | $6.84 of vehicle cost + ~$16.67 of paid time per day |
| 3. Wage structure | ±$1/hr loaded, or trimming one idle paid hour | −$0.40 to −$1.25 | Real but slow — and cutting pay costs you drivers |
| 4. Software | Adding route planning at $20–25/driver/mo | +$0.05 to +$0.08 | The line that buys levers 1 and 2 |
The ranking is the point. Owners argue about wages and gas cards; the spreadsheet says stops-per-route dominates, miles come second, and everything else is decimal dust. Software is a nickel a stop that exists to move the four-dollar line above it. (Redistributing stops across drivers is its own craft — see how to dispatch routes to multiple drivers.)
Measure your own cost per stop this week
Benchmarks orient; your number decides. One week, five steps, no new tools:
- Pick one normal week — not a holiday, not your peak.
- Total the loaded driver pay for delivery hours: gross wages × 1.15–1.18 for payroll taxes and workers' comp.
- Total the route miles (odometer or your route planner's logs) and multiply by $0.76 — or your own tracked cost per mile if you have a year of receipts.
- Add the week's share of software and delivery-only overhead (vehicle lease, delivery insurance if separate).
- Divide by stops completed — completed, not planned. Failed attempts are a cost, not a denominator.
Then place yourself on the profile table above. Inside the range for your density: go work lever 1. Above it: the first suspects are paid idle time and route miles, in that order. Below it: re-check step 3 — the most common way small fleets "beat" the benchmark is by forgetting that the van wears out.
Frequently Asked Questions
What is the average cost per delivery stop?
For a small local fleet in 2026: roughly $5–7 per stop on dense urban multi-drop routes (35–45 stops per driver per day), $9.50–17 on suburban local delivery (15–25 stops per day), and $24–42 on rural routes (8–12 stops per day) — built from a ~$25/hr loaded driver cost (BLS May 2024 median wage plus employer payroll costs) and the IRS 76¢/mile vehicle rate. The often-quoted $10.10 average is Capgemini's 2019 enterprise figure, not a small-fleet benchmark.
How do I calculate my cost per delivery stop?
Divide one week's fully loaded delivery cost by stops completed. Loaded cost = driver pay including employer payroll taxes and workers' comp, plus route miles × an all-in vehicle rate (the IRS 76¢/mile covers fuel, maintenance, insurance and depreciation), plus software. Example: $200 of loaded pay + 60 miles × $0.76 = $245.60 for a 20-stop day, or $12.28 per stop.
Why is my cost per stop higher than the $10 industry average?
Because the average isn't yours. Capgemini's $10.10 (January 2019) describes enterprises whose parcel-network drivers clear 100+ stops a day. A suburban fleet doing 15–25 stops a day lands at $9.50–17 per stop on identical input quality — that's the density difference, not inefficiency.
How much does fuel cost per delivery stop?
At the EIA national average of $4.085/gal (week of August 24, 2026) and 15 mpg, fuel is about 27¢ per mile: roughly $0.82 per stop on a 60-mile, 20-stop suburban route, and about $4.09 per stop on a 150-mile, 10-stop rural route. Driver time, not fuel, dominates dense routes.
What do courier companies charge per stop?
Published 2026 rate cards put routed local delivery at roughly $13–27 per stop: Breakaway Courier (New York) lists $26.50 base-zone, $21.15 per delivery on its economy service (10-delivery minimum), and $13.15 per additional same-building stop; pricing guides cite ~$22 per route-stop for scheduled medical routes. Market prices are a ceiling on what your internal cost should be.
What is the cheapest way to lower cost per delivery stop?
Add stops to routes you already run. On a $245.60/day suburban route the average stop costs $12.28, but a marginal stop added to the same territory costs about $3.50–4. Density is worth several dollars per stop; cutting 15% of miles via optimization is worth ~$1–1.30; a $1/hr wage change moves ~$0.40; route planning software costs $0.05–0.08 per stop.